Despite finding lots of opportunities to collect premium in June, the month ended up being my worst on record thus far. The reason? I played a meme stock incorrectly. Specifically, $AMC. More details on that to follow, but first an update on the numbers…
I collected $230 in premiums, just shy of my previous record of $232.90 from March. Capital in my trading account reduced by $502 or -11.7%! As you will see below, this came about from that one bad trade and is a cautionary tale of the risk of destruction of capital when buying long option positions.
My positions & trades
Note: these summaries were written several weeks ago, but this post has sat unfinished in my drafts for a while
$AAL, 100 shares at $13.98 average ($1,398 total principal). As of the 1st of the month, my principal in American Airlines is up 51.7% ($723), however I am capped at a $402 gain due to a $18 strike covered call position expiring August 20 (I’ve already rolled it forward from July expiration to August for this month). I continue to be able to roll it forward for about a $20 profit, which meets my 1% goal. Since this is a classic covered call and not a PMCC, I plan to continue rolling this until I can’t collect a reasonable credit any longer.
$AMC, no current positions. So here is where everything went wrong! At the beginning of the month of June, $AMC started shooting up. When it was in the mid to upper $20’s, I decided to BUY an out of the money put at the $20 strike for August 20. I figured this was all nonsense and this would give me over two months to be right. Well unfortunately it continued up and the value of my long put tanked. I held the position for a while, but ultimately closed it for a $400+ loss in July (so technically the sale doesn’t belong in my June recap post) (also note, I wrote this recap on August ~11th, before it started to pullback into the $30s!).
To reduce the sting however, I did sell various puts that were essentially calendar spreads at the $20 strike that were shorter days to expiration than my long put due in August. For example, I sold the June 18 $20 strike put. Those added up to be $107.
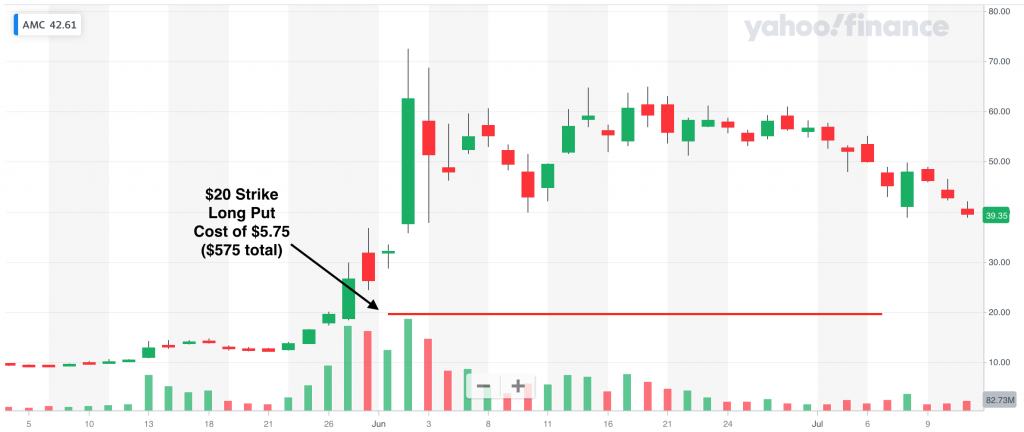
While most people agree AMC is overvalued to say the least, I learned that it is difficult to play the direction correctly on these meme stocks. I think it is better to sell premium and most often with protection, like with credit spreads or perhaps even iron condors. I am trying this, for example, on $SPCE below.
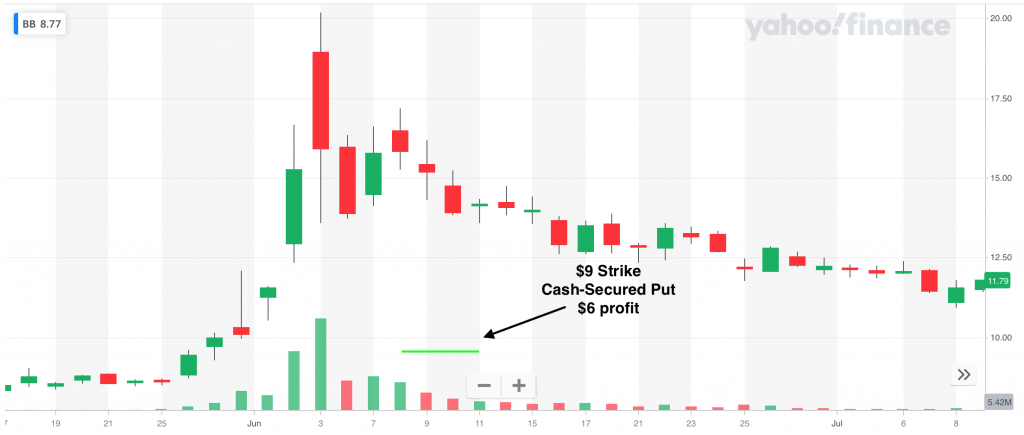
$BB, no current positions. This was another meme stock trade and more in line with how I think it is best to trade these stocks. I sold a $9 strike cash-secured put with 17 days til expiration. I collected a $13 premium which would be an annualized return of 29% for a .05 delta put! I closed the trade after just a few days because I was profitable and the stock was moving against me. I was essentially wrong about the direction of the trade, but was right on the change in volatility. Had the stock continued to go up and not down, I likely would have held a bit longer and to squeeze out a bit more premium.
$GE, 1x LEAP January 21, 2022 $5 Strike Call at a cost of $6.55; 1x July 23 $12.50 Covered Call. Nothing too exciting here. I rolled my June expiration covered call forward to July for a net credit of $20, which is a 2.7% return (26.3% annualized). GE has been hovering in this $12.50 to $14 range. Since my long leg is now less than 6 months until expiration, I am considering letting this expire in the money and allow the LEAP to be called away.
$F, 1x LEAP January 21, 2022 $10 Strike Call at a cost of $5.65; 1x July 30 $12.50 Covered Call. I like trading Ford options because there is a ton of liquidity. I actually sold my short leg initially ITM at $15 when it was trading in the $15.50 range. This proved to be the right call as we’ve seen a strong pull back in Ford. I wish I had gone with a longer expiration on the LEAP of at least 12 months. We will see how this turns out.
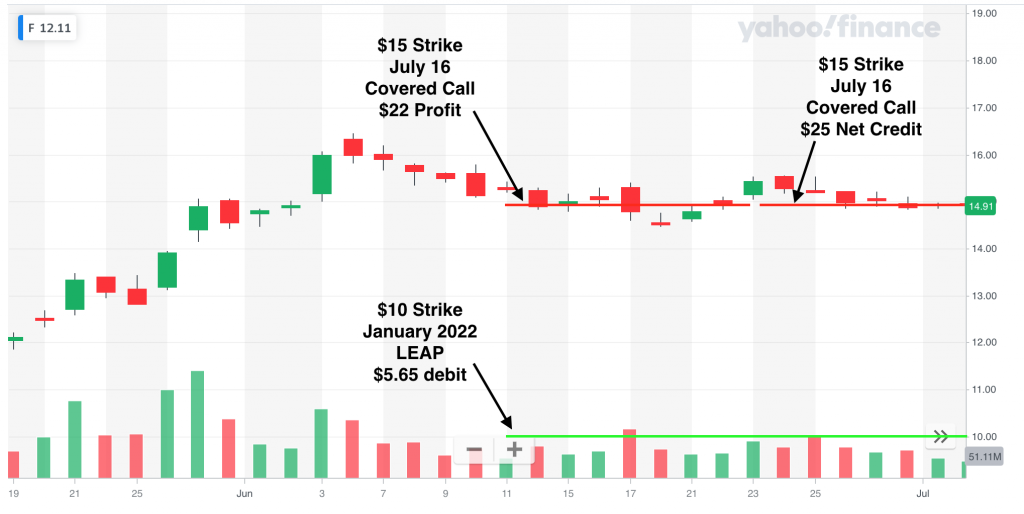
I did roll my initial ITM covered call from June to July expiration when the stock dropped near my $15 strike. There is always an increase in premium when this happens and I’ve found it to be a good time to roll out if possible. I earned $22 profit on the first trade (It was actually $87 but because I sold this one ITM I am doing some financial engineering to make my LEAP at an actual cost of $500. This way if I get assigned on my $15 strike, I don’t need to count the LEAP being called away at $5 as a loss.).
$SNDL, 100 shares at $1.58 average ($158 total principal); 1x $1.50 July 16 covered call. Judging by the current share price of under $1, this is looking like a pretty poor trade. However, I have been able to grab $7 to $8 credits each month for selling at $1.50 strike. This
$SPCE, 1x $25/$20 Strike August 20 Put Credit Spread. After my little AMC debacle I wanted revenge! But didn’t want to dig myself a bigger hole, either. As mentioned above, I think credit spreads may be the best way to go about these meme stock trades. My reasons are defined risk (equal to the risk of the spread, i.e., $500 on this position) and the long position is a hedge against the possibility of increased volatility. Just when you think the implied volatility for these type of stocks can’t go any higher, and you’re tempted to open a short option position, things get even crazier and you can be left way underwater on the position, even if you aren’t actually in the money. The long position helps limit this because while the short leg is increasing in value, so too is your long leg, albeit not by quite as much. I opened this position for a credit of $50, which would be a nice 10% gain! However, I will likely close the position if I can get a 50% gain or so.
Extra Mortgage Principal Paid
In June I began to have some real changes of heart in terms of how I was going about paying down this mortgage. While I am not shying away from the idea of paying off mortgage debt, I clearly feel that there are better ways to go about this rather than just paying extra principal every month. My results thus far speak for themselves, as I’m up over a $1000 pursuing my current strategies rather than just chucking away my extra cashflow towards the mortgage principal (“Benchmark #2”).
Recall that my latest idea was to put 1% of my monthly option trading profits towards the mortgage. Anything over would go towards buying preferred stocks or “Hedgefundie’s Excellent Adventure.” But even that 1% seemed like too much. Surely this can be optimized further. (even if that comes at the cost of complexity, which I clearly don’t have any aversion to!) Enter Cash Flow Index…
As I’m writing this I’m realizing all this belongs in its own post (or series of posts), so I will get straight to the point. Cash Flow Index is a way of quantifying the efficiency of a debt.
CFI = (Loan Balance) / (Monthly Payment)
If the debt is large but only requires a small monthly payment (like the early stages of a mortgage), it is efficient and has a high CFI. Conversely, if the debt is relatively small but requires a larger debt payment (like the late stages of a mortgage), it is less efficient and therefore might make more sense to pay off. The longer the amortization schedule, the more efficient. A 5 year car loan? Not so efficient. I like CFI because it balances out some of the effects of interest rates and duration of the loan on your debt payment.
My CFI for my mortgage after June’s payment was 230.1 ($503,051 / $2,186 = 230.1).
With that in mind, I’m toying with ways of incorporating that into my extra mortgage payments. For the month of June, I decided to divide the principal balance in my trading account by the CFI. This came out to about $19 ($4,310.44/230.1 = $18.73). As I get closer to paying off the mortgage, the amount that will go towards the principal will accelerate. 230.1^-1 is 0.43% (5.2% yearly). When the CFI is down to 100, which currently is month 243, that would mean 1% monthly will go towards the principal.
My preferred stock portfolio paid $1.72 in dividends and I “withdrew” $1 from my new risk parity portfolio (formerly Hedgefundie… read below), for a total of $21.72 towards mortgage. I have now paid an additional $445.14 towards the mortgage principal, which will save $678.06 in interest over the life of the loan.
The portfolio formerly known as “Hedgefundie’s Excellent Adventure”
I decided to switch my Hedgefundie strategy to a more classic risk parity style portfolio. Risk parity portfolios use a mixture of equities, bonds, gold, commodities, CEFs, REITs, etc. Depending on the mixture, they can often have equity-like returns with much lower volatility. More on this to come in another post, but for now I’m using a mixture that heavily weights equities and uses leverage. Just not quite as much as Hedgefundie’s Excellent Adventure! I plan to take a 4% yearly withdrawal (i.e., 1/300th of the portfolio value each month) to go towards the mortgage principal. However, I’m still making deposits from my option trading so I will reduce that deposit net of the required 4% withdrawal for the month. At the end of the month the portfolio was at $267.16. I just rounded the net withdrawal up to $1.
Benchmark Comparisons
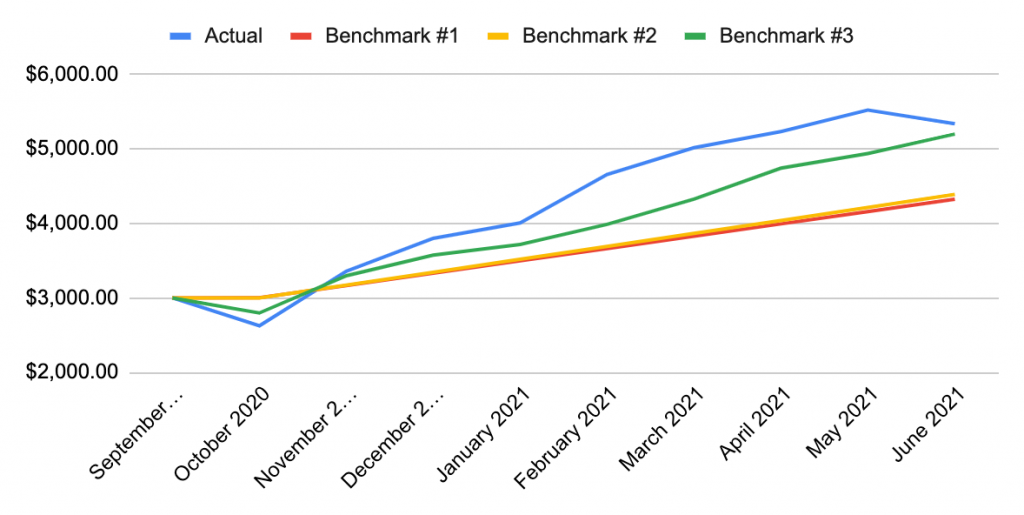
In my introduction post I identified three different benchmarks I will be comparing my performance to. Benchmark #1 is putting all of my savings from my refinance, plus a 1 month skipped mortgage payment, into a savings account. When I wrote that post I was actually getting 0.6% APY, but it has reduced twice down to just 0.3% now. Benchmark #2 is putting all of those savings straight into extra monthly payments to the mortgage principal. Finally, Benchmark #3 is simply buying $SPY.
After 9 months I have invested $4,313.68 (initial $3,000 + $164.21 per month). Benchmark #1 is at $4,322.85, Benchmark #2 is at $4,388.79, Benchmark #3 is at $5,197.40. My actual total is at $5,335.53. June was my first month since month #1 that had a negative return. Total return is now at $1,021.85, or 23.7% (32.8% CAGR). My returns include the value of my principal in my trading account + the monthly contribution of $64.21 and interest into my savings + the difference between the original loan and what is actually remaining this month. My results are beating Benchmark #1 by 23.4%, #2 by 21.6% and #3 by 2.7%.